Contribution Analytics (STARTER)
- Introduced in GitLab Starter 8.3.
- Introduced for subgroups in GitLab 12.2.
Overview
With Contribution Analytics you can get an overview of the following activity in your group:
- Issues
- Merge requests
- Push events
To view the Contribution Analytics, go to your group's Overview > Contribution Analytics page.
Use cases
- Analyze your team's contributions over a period of time, and offer a bonus for the top contributors.
- Identify opportunities for improvement with group members who may benefit from additional support.
Using Contribution Analytics
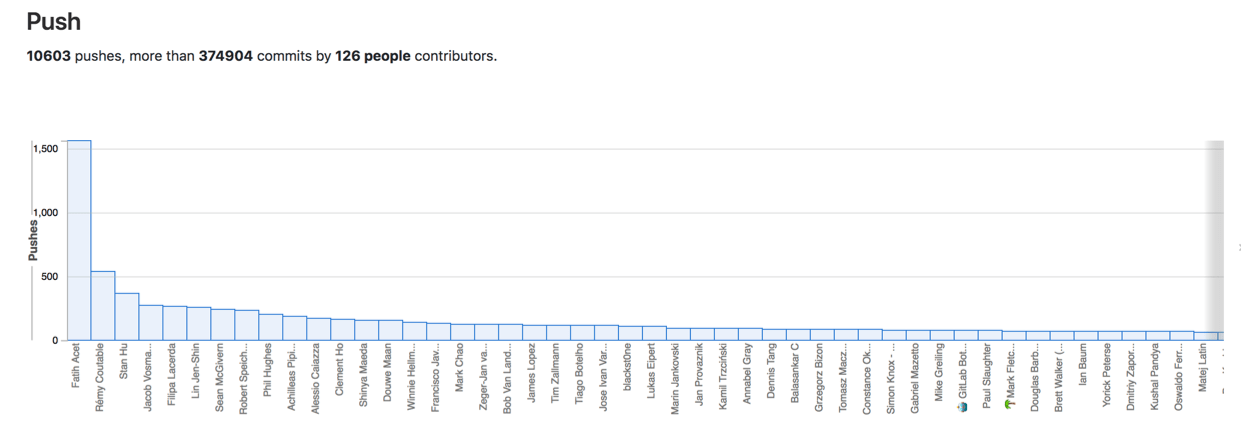
There are three main bar graphs that illustrate the number of contributions per group member for the following:
- Push events
- Merge requests
- Closed issues
Hover over each bar to display the number of events for a specific group member.
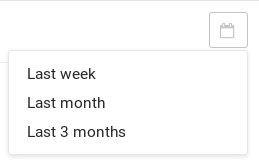
Changing the period time
You can choose from the following three periods:
- Last week (default)
- Last month
- Last three months
Select the desired period from the calendar dropdown.
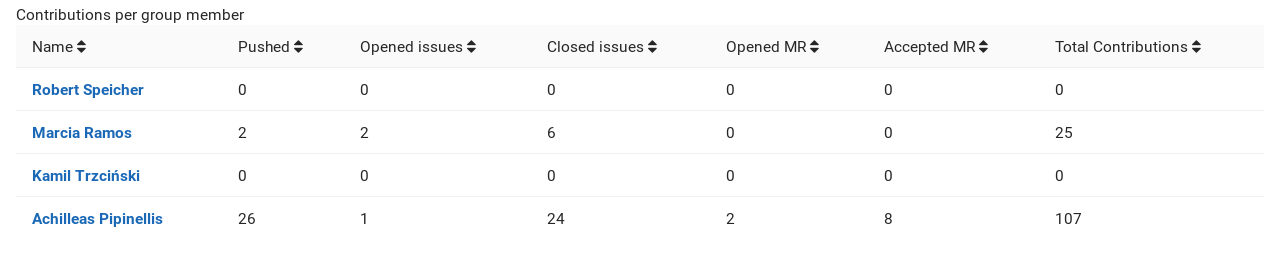
Sorting by different factors
Contributions per group member are also presented in tabular format. Click a column header to sort the table by that column:
- Member name
- Number of pushed events
- Number of opened issues
- Number of closed issues
- Number of opened MRs
- Number of accepted MRs
- Number of total contributions